
Chesapeake Bay Aerial Images
Look at aerial images of chlorophyll, temperature, salinity, and primary productivity levels from the Chesapeake Bay remote Sensing Program based on year and location in the Bay.
Look at aerial images of chlorophyll, temperature, salinity, and primary productivity levels from the Chesapeake Bay remote Sensing Program based on year and location in the Bay.

Access NOAA’s real time data from different points in the Chesapeake Bay as well as historic information back to the time of John Smith.

Includes SOL aligned Data Driven Lesson Plans, Climate Data Resources, Historical Data Resources, Ocean & Freshwater Data Resources, and Weather & Atmospheric Data Resources. The data collection consists of ocean

Enjoy NOAA’s interactive maps and local data! Explore modeled sea level rise data and scenarios through an Interactive Map with local scenarios and multiple data layers.

Enjoy browsing VIMS BRIDGE, interactive maps, and datasets! Includes education datasets for the classroom on Biology, Human Activities, Ecology, Physics, Chemistry, Climate Geology, and Ocean Observing.

Enjoy browsing NASA global satellite imagery, interactive maps, and data in real time! Customize your map by adding different data layers or events (wildfires, hurricanes, coastlines etc.) Use the Add

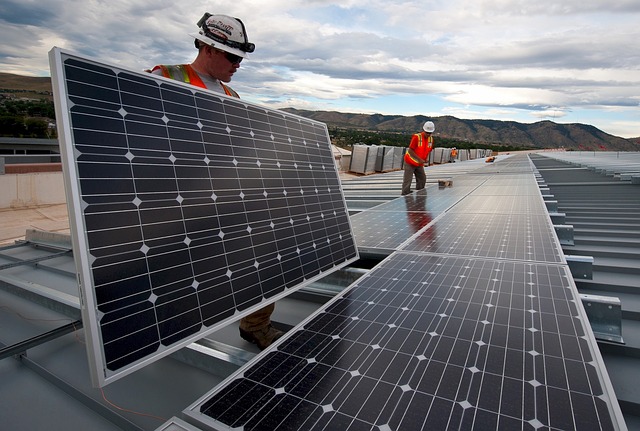
View real time data on energy produced, today’s energy balance, cost and carbon savings from Norfolk Academy’s solar panels.

Article written by a Norfolk Academy student on the solar panel installation
Information of financing solar energy, whether a nonprofit, business, or on a home. Included template documents, town hall files, and information on schools going solar.

Virginia Beach Case Study on Ruth McElroy Amundsen’s Opportunity Fund. Includes direct quotes, statistics, and background information.
Notifications