Interactive Water Quality Database
Enjoy an online interactive database of water quality monitoring reports from the Environmental Protection Agency. Learn the current health condition of any river in the US and check to see

Enjoy an online interactive database of water quality monitoring reports from the Environmental Protection Agency. Learn the current health condition of any river in the US and check to see
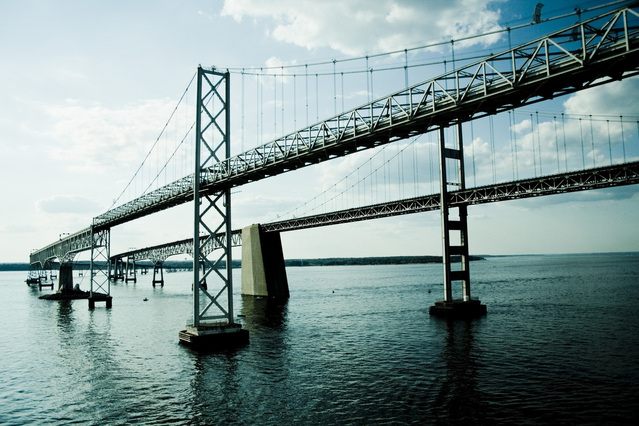
Look at aerial images of chlorophyll, temperature, salinity, and primary productivity levels from the Chesapeake Bay remote Sensing Program based on year and location in the Bay.
Access NOAA’s real time data from different points in the Chesapeake Bay as well as historic information back to the time of John Smith.
Includes SOL aligned Data Driven Lesson Plans, Climate Data Resources, Historical Data Resources, Ocean & Freshwater Data Resources, and Weather & Atmospheric Data Resources. The data collection consists of ocean
Enjoy NOAA’s interactive maps and local data! Explore modeled sea level rise data and scenarios through an Interactive Map with local scenarios and multiple data layers.

Enjoy browsing VIMS BRIDGE, interactive maps, and datasets! Includes education datasets for the classroom on Biology, Human Activities, Ecology, Physics, Chemistry, Climate Geology, and Ocean Observing.

Enjoy browsing NASA global satellite imagery, interactive maps, and data in real time! Customize your map by adding different data layers or events (wildfires, hurricanes, coastlines etc.) Use the Add

View real time data on energy produced, today’s energy balance, cost and carbon savings from Norfolk Academy’s solar panels.
A collection of data, case studies, and information on climate and resilience for educators. Includes educational videos, graphs, maps, and more on climate risks, vulnerabilities, and actions.
Local students OWN IT. Virginia Beach City Public Schools (VBCPS) students recently participated in the Our Watershed Needs Identified for Today and Tomorrow (OWN-ITT) competition. Case Studies including story maps
Thank you for your interest in the Elizabeth River Project’s Ryan Resilience Lab. We’re delighted that our site is in high demand. As the Ryan Resilience Lab is operated by a small non-profit with a big environmental mission, please help us make sure your event is a great fit.
Our priority is to host groups with relevance to our mission: to restore the Elizabeth River through equitable collaboration with diverse communities, governments, and businesses. When space and staff support are available, we are happy to host such groups free of charge, but do request that you consider an organizational membership and allow us to offer the opportunity for individual memberships.
Please fill this form out at least 30 days in advance of the event.