
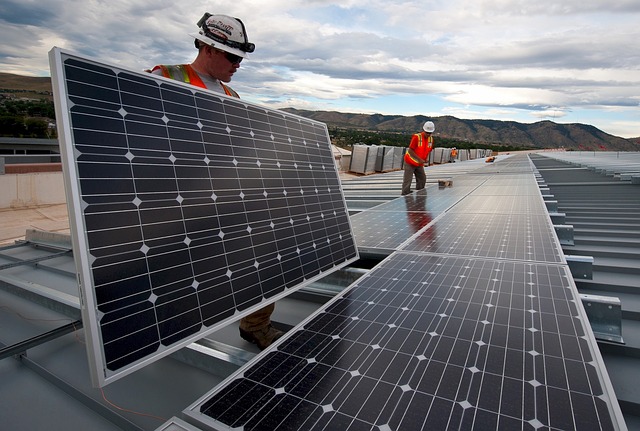
Norfolk Academy : Article on New Solar Installation (2019)
Norfolk Academy news article on their solar panel installation. Learn about energy conservation, solar teaching opportunities, and technical aspects of the panels.
Norfolk Academy news article on their solar panel installation. Learn about energy conservation, solar teaching opportunities, and technical aspects of the panels.
Keep up with the Bay Program’s most recent restoration efforts and research. Browse articles and in-depth feature stories to learn about the latest Bay news.
Enjoy an online interactive database of water quality monitoring reports from the Environmental Protection Agency. Learn the current health condition of any river in the US and check to see
Look at aerial images of chlorophyll, temperature, salinity, and primary productivity levels from the Chesapeake Bay remote Sensing Program based on year and location in the Bay.

View real time data on energy produced, today’s energy balance, cost and carbon savings from Norfolk Academy’s solar panels.
Article written by a Norfolk Academy student on the solar panel installation
Information of financing solar energy, whether a nonprofit, business, or on a home. Included template documents, town hall files, and information on schools going solar.
Virginia Beach Case Study on Ruth McElroy Amundsen’s Opportunity Fund. Includes direct quotes, statistics, and background information.
Local students OWN IT. Virginia Beach City Public Schools (VBCPS) students recently participated in the Our Watershed Needs Identified for Today and Tomorrow (OWN-ITT) competition. Case Studies including story maps
Downloadable PDFs on C-PACE (Commercial property Assessed Clean Energy) for the Mid-Atlantic Region. C-PACE is a financing mechanism for owners of commercial property to fund energy-related property improvements with no upfront costs.