Chesapeake Bay foundation : Chesapeake Classrooms Teacher’s Guide
The complete 2024 Chesapeake Classrooms Teacher’s Guide is available in downloadable format. This is an excellent companion resource for planning and documenting your classroom MWEE!
- Primary Topic: Climate Change, Marine Education, Reduce Carbon Footprint, Sea Level Change
- Sub Topic: Chesapeake Bay Watershed, Encourage Resilient Action, Local Resource, Water Quality & Pollution
- Grade Level: Elementary School, High School, Middle School
- Resource Type: Educator Guide, Educator Professional Development, Lesson Plan
- Professional Development Type: Teacher/Training Workshop
Chesapeake Bay Foundation : Educator’s Guide to the Water Quality Interactive Map
Educator guide to understanding the CBF Water Quality map. Includes field names and definitions, water quality parameters and methods, eutrophication process, how teacher and students can use the CBF GIS app (create graphs and analyze the data), and lesson plans and activities.
- Primary Topic: Climate Change, Marine Education, Sea Level Change
- Sub Topic: Chesapeake Bay Watershed, Ecology, Flooding, Flooding Prevention, Local Resource, Water Quality & Pollution
- Grade Level: Elementary School, High School, Middle School
- Resource Type: Activity, Educator Guide, Interactive Map, Lesson Plan
NOAA’s Tides & Currents : Interactive Map on Relative Sea Level Trends
Learn about Tides and Currents and their interaction in accordance with sea level rise. Explore this Interactive Map on Sea Level Rise trends around the globe.
- Primary Topic: Climate Change, Sea Level Change
- Sub Topic: Chesapeake Bay Watershed, Flooding, Flooding Prevention, Weather & Natural Disasters
- Grade Level: High School, Middle School
- Resource Type: Dataset, Interactive Map
Virginia Institute of Marine Science : Sea Level Rise Report Cards

Want to know how the sea level in your area is changing due to global warming and other factors? The Virginia Institute of Marine Science updates its website each year as annual tide-gauge data become available. The site displays recent sea-level trends and projects sea-level height to the year 2050 for 32 localities (including Norfolk) along the U.S. East, Gulf, West, and Alaskan coasts.
- Primary Topic: Sea Level Change
- Sub Topic: Chesapeake Bay Watershed, Ecology, Flooding, Flooding Prevention, Local Resource, Weather & Natural Disasters
- Grade Level: High School, Middle School
- Resource Type: Activity, Background Information or Research, Dataset, Interactive Map
Virginia Institute of Marine Science : Tidewatch Interactive Map

An interactive map from VIMS, useful for advanced students studying climate change and sea level rise in Virginia.
- Primary Topic: Climate Change, Sea Level Change
- Sub Topic: Chesapeake Bay Watershed, Flooding, Flooding Prevention, Local Resource, Water Quality & Pollution
- Grade Level: High School, Middle School
- Resource Type: Activity, Dataset, Interactive Map
Virginia Institute of Marine Science : Sea Level Rise Projection Map

An interactive map from VIMS, useful for advanced students studying climate change and sea level rise in Virginia.
- Primary Topic: Climate Change, Sea Level Change
- Sub Topic: Chesapeake Bay Watershed, Flooding, Local Resource
- Grade Level: High School, Middle School
- Resource Type: Activity, Dataset, Interactive Map
Chesapeake Bay Foundation : ‘What’s In Our Water(shed)?’ Interactive Map Activities
Series of classroom investigative guides and interactive maps using ArcGIS. Discusses water quality through data analysis, creating graphs, analyzing results, and coming to a conclusion.
- Primary Topic: Climate Change, Sea Level Change
- Sub Topic: Chesapeake Bay Watershed, Conservation, Ecology, Encourage Resilient Action, Flooding, Flooding Prevention, Local Resource, Water Quality & Pollution
- Grade Level: High School, Middle School
- Resource Type: Activity, Background Information or Research, Dataset, Interactive Map
Chesapeake Bay Foundation : Interactive Water Quality Map
This is an interactive ArcGIS water quality map where students collect water quality data throughout the entire Chesapeake Bay Watershed with CBF educators and enter the data into the CBF database. Explore information collected at each data point, including turbidity, water temperature, dissolved oxygen, pH, salinity, phosphate, and nitrate.
- Primary Topic: Sea Level Change
- Sub Topic: Chesapeake Bay Watershed, Local Resource, Water Quality & Pollution
- Grade Level: High School, Middle School
- Resource Type: Dataset, Interactive Map
Chesapeake Bay Foundation : Interactive Map Portal
An in-depth variety of maps featuring different angles and topics on the Chesapeake Bay’s 64,000 square miles. Categories include geography, pollution, land use, aquatic life, and economic importance.
- Primary Topic: Climate Change, Marine Education, Sea Level Change
- Sub Topic: Chesapeake Bay Watershed, Conservation, Ecology, Encourage Resilient Action, Flooding, Flooding Prevention, Local Resource, Renewable Resources/Energy Conservation, Water Quality & Pollution, Weather & Natural Disasters, Wetlands
- Grade Level: Elementary School, High School, Middle School
- Resource Type: Background Information or Research, Case Study, Dataset, Downloadable Map, Impact Calculator, Interactive Map
Chesapeake Bay Foundation : Downloadable Chesapeake Bay Watershed Map

Downloadable poster-sized map of the Chesapeake Bay Watershed. Includes brief information about the natural history and fragile habitat of the Bay.
- Primary Topic: Marine Education
- Sub Topic: Chesapeake Bay Watershed, Ecology, Local Resource, Water Quality & Pollution
- Grade Level: Elementary School, High School, Middle School
- Resource Type: Background Information or Research, Downloadable Map
Norfolk Academy : Article on New Solar Installation (2019)

Norfolk Academy news article on their solar panel installation. Learn about energy conservation, solar teaching opportunities, and technical aspects of the panels.
- Primary Topic: Reduce Carbon Footprint
- Sub Topic: Conservation, Encourage Resilient Action, Local Resource, Renewable Resources/Energy Conservation, Solar Programs
- Grade Level: Elementary School, High School, Middle School
- Resource Type: Background Information or Research, Case Study, News Article
Chesapeake Bay Program : Recent Stories
Keep up with the Bay Program’s most recent restoration efforts and research. Browse articles and in-depth feature stories to learn about the latest Bay news.
- Primary Topic: Climate Change, Marine Education, Sea Level Change
- Sub Topic: Chesapeake Bay Watershed, Conservation, Ecology, Encourage Resilient Action, Local Resource, Water Quality & Pollution, Wetlands
- Grade Level: Elementary School, High School, Middle School
- Resource Type: News Article
Scientific American Article – Children Change Parents’ Minds on Climate Change

A news article about Children who change their parents’ minds about climate change. Focuses on Swedish teenager, Greta Thunberg, who mad a speech to the United Nations and is encouraging students to make their voices heard.
- Primary Topic: Climate Change
- Sub Topic: Encourage Resilient Action
- Grade Level: Elementary School, High School, Middle School
- Resource Type: Case Study, Educational Programs, News Article
- Program Type: Beyond the Classroom Program
Smithsonian Environmental Research Center Database

Search in the database from the Smithsonian Environmental Research Center to add real world data to your classroom setting. Data sets include research & citizen science data, climate science, wetlands, ecology, National Ballast Information Clearinghouse and more!
- Primary Topic: Marine Education
- Sub Topic: Conservation, Ecology, Flooding, Flooding Prevention, Water Quality & Pollution
- Grade Level: Elementary School, High School, Middle School
- Resource Type: Activity, Background Information or Research, Case Study, Dataset, Interactive Map
Interactive Water Quality Database
Enjoy an online interactive database of water quality monitoring reports from the Environmental Protection Agency. Learn the current health condition of any river in the US and check to see what actions are currently being done to improve health and reduce pollution.
- Primary Topic: Marine Education
- Sub Topic: Ecology, Food Production, Local Resource, Water Quality & Pollution
- Grade Level: Elementary School, High School, Middle School
- Resource Type: Background Information or Research, Dataset, Video
Chesapeake Bay Aerial Images
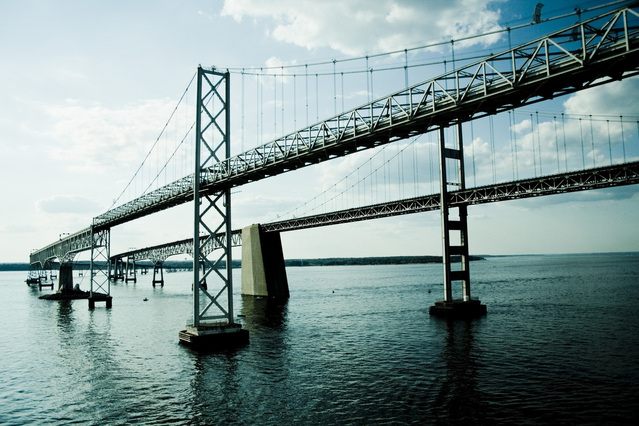
Look at aerial images of chlorophyll, temperature, salinity, and primary productivity levels from the Chesapeake Bay remote Sensing Program based on year and location in the Bay.
- Primary Topic: Marine Education
- Sub Topic: Ecology, Flooding, Food Production, Local Resource, Water Quality & Pollution
- Grade Level: High School, Middle School
- Resource Type: Background Information or Research, Case Study, Dataset, Video
NOAA’s Historic Chesapeake Bay Data
Access NOAA’s real time data from different points in the Chesapeake Bay as well as historic information back to the time of John Smith.
- Primary Topic: Sea Level Change
- Sub Topic: Ecology, Flooding, Weather & Natural Disasters
- Grade Level: High School, Middle School
- Resource Type: Dataset, Interactive Map
NOAA’s Data Resources for Educators.
Includes SOL aligned Data Driven Lesson Plans, Climate Data Resources, Historical Data Resources, Ocean & Freshwater Data Resources, and Weather & Atmospheric Data Resources. The data collection consists of ocean and atmospheric data sources that are user friendly and appropriate for classrooms and informal education settings.
- Primary Topic: Sea Level Change
- Sub Topic: Chesapeake Bay Watershed, Flooding, Flooding Prevention, Weather & Natural Disasters
- Grade Level: Elementary School, High School, Middle School
- Resource Type: Activity, Dataset, Interactive Map
NOAA’s Sea Level Rise Viewer.
Enjoy NOAA’s interactive maps and local data! Explore modeled sea level rise data and scenarios through an Interactive Map with local scenarios and multiple data layers.
- Primary Topic: Sea Level Change
- Sub Topic: Chesapeake Bay Watershed, Conservation, Flooding, Flooding Prevention, Weather & Natural Disasters, Wetlands
- Grade Level: High School, Middle School
- Resource Type: Activity, Background Information or Research, Dataset, Interactive Map, Lesson Plan
VIMS BRIDGE Ocean Science Data Archive Database.

Enjoy browsing VIMS BRIDGE, interactive maps, and datasets! Includes education datasets for the classroom on Biology, Human Activities, Ecology, Physics, Chemistry, Climate Geology, and Ocean Observing.
- Primary Topic: Marine Education
- Sub Topic: Conservation, Ecology, Water Quality & Pollution, Weather & Natural Disasters
- Grade Level: High School, Middle School
- Resource Type: Activity, Dataset, Interactive Map, Lesson Plan