Online Resilience Education Database

Our free online database is filled with hundreds of documents, videos, photographs, studies, news articles and more. Now, you can explore the river from any device, anytime!

  • Primary Topics

  • Secondary Topics

  • Reset
Chesapeake Bay Foundation ArcGIS Interactive Map
cbf2

Includes ArcGIS water quality interactive map where students collect water quality data throughout the entire Chesapeake Bay Watershed with CBF educators and entered the data into the CBF database.  Explore information collected at each data point including turbidity, water temperature, dissolved oxygen, pH, salinity, phosphate, and nitrate.

Chesapeake Bay Foundation Downloadable Maps
cbf2

An in-depth variety of maps featuring different angles and topics on the Chesapeake Bay’s 64,000 square miles.  Categories include geography, pollution, land use, aquatic life, and economic importance.

Downloadable Chesapeake Bay Watershed Map
cbf2

Downloadable poster of the Chesapeake Bay Watershed map.  Includes brief information about the natural history and fragile habitat of the Bay.

Virginia Pilot Op-Ed: Economic Gap & Opportunity Zones
vp

News article about Opportunity zones and food production.  Topics include food deserts, solar power installations, and energy. Op-Ed piece in the Virginia Pilot arguing for Opportunity Zones to heal the widening economic gap in America. 

Virginia Pilot Article : Opportunity Zone Fund for Solar Power
vp

Virginian Pilot news article on Opportunity Zone fund to help bring solar benefits to low-income households in Norfolk.

Norfolk Academy Article – Solar Installation
na2

Norfolk Academy news article on their solar panel installation. Learn about energy conservation, solar teaching opportunities, and technical aspects of the panels.

Virginia Pilot Article – Norfolk Academy Solar Panels
vp

Virginia Pilot news article on Norfolk Academy solar panel installation.  Learn about the background, process and current energy conservation

Chesapeake Bay Articles
cbf2

Keep up with the Bay Program’s most recent restoration efforts and research.   Enjoy browsing articles and news stories featuring recent updates and changes within the Chesapeake Bay.

Article on Hampton Roads Resilience Projects
hrpdc

Article and data about the Hampton Roads Resilience Projects Dashboard: The Resilience project discusses sea level rise and flooding in the Hampton Roads Area

Scientific American Article – Children Change Parents’ Minds on Climate Change
sa

A news article about Children who change their parents’ minds about climate change.  Focuses on Swedish teenager, Greta Thunberg, who mad a speech to the United Nations and is encouraging students to make their voices heard.

Smithsonian Environmental Research Center Database
serc

Search in the database from the Smithsonian Environmental Research Center to add real world data to your classroom setting. Data sets include research & citizen science data, climate science, wetlands, ecology, National Ballast Information Clearinghouse and more!

Interactive Water Quality Database
epa

Enjoy an online interactive database of water quality monitoring reports from the Environmental Protection Agency.   Learn the current health condition of any river in the US and check to see what actions are currently being done to improve health and reduce pollution.

Chesapeake Bay Aerial Images
the-chesapeake-bay-bridge-on-the-chesapeake-in-the-united-states-1207671-639x426

Look at aerial images of chlorophyll, temperature, salinity, and primary productivity levels from the Chesapeake Bay remote Sensing Program based on year and location in the Bay.

NOAA’s Historic Chesapeake Bay Data
noaa

Access NOAA’s real time data from different points in the Chesapeake Bay as well as historic information back to the time of John Smith.

NOAA’s Data Resources for Educators.
noaa

Includes SOL aligned Data Driven Lesson Plans, Climate Data Resources, Historical Data Resources, Ocean & Freshwater Data Resources, and Weather & Atmospheric Data Resources.  The data collection consists of ocean and atmospheric data sources that are user friendly and appropriate for classrooms and informal education settings.

NOAA’s Sea Level Rise Viewer.
noaa

Enjoy NOAA’s interactive maps and local data! Explore modeled sea level rise data and scenarios through an Interactive Map with local scenarios and multiple data layers.

VIMS BRIDGE Ocean Science Data Archive Database.
vims

Enjoy browsing VIMS BRIDGE, interactive maps, and datasets! Includes education datasets for the classroom on Biology, Human Activities, Ecology, Physics, Chemistry, Climate Geology, and Ocean Observing.

Real time NASA Satellite Imagery & Data
nasa

Enjoy browsing NASA global satellite imagery, interactive maps, and data in real time! Customize your map by adding different data layers or events (wildfires, hurricanes, coastlines etc.) Use the Add Layers button to select from hundreds of possible data categories.

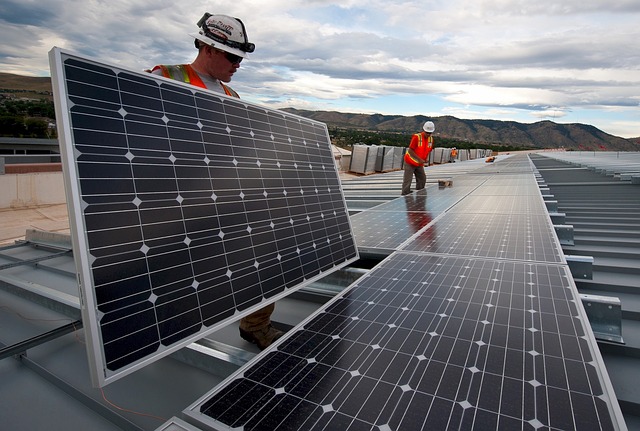
Norfolk Academy Solar Panels Data
na2

View real time data on energy produced, today’s energy balance, cost and carbon savings from Norfolk Academy’s solar panels.

Norfolk Academy Solar News Article
na2

Article written by a Norfolk Academy student on the solar panel installation

Youth Water Monitoring Results

Entry Data

Name(Required)
MM slash DD slash YYYY
Time(Required)
:

Sample Data

Bacteria

Observations

Drop files here or
Accepted file types: jpg, png, heic, tiff, Max. file size: 256 MB.
    Add any field observation photos here